Quick Start
Most of this quick start guide is based upon the great opentracing tutorial by Yuri Shkuro. Once you’ve got a feel for how OpenTracing works here, feel free to reference his repo to learn more.
There’s also a Katakoda lesson that follows the tutorial, if you don’t want to install and setup Docker on your local system just yet.
Installing an OpenTracing Platform
In order to see and ship our traces, we’ll first need to have a place to send them to and then visualize the results.
For this Quickstart guide, we’ll begin by using the Jaeger platform, and their helpful Docker image. If you’re using another platform, most everything else in this document will still apply, other than your initial configuration of where the tracer is.
So, if you’ve got Docker already installed, you can just run the following command in your terminal:
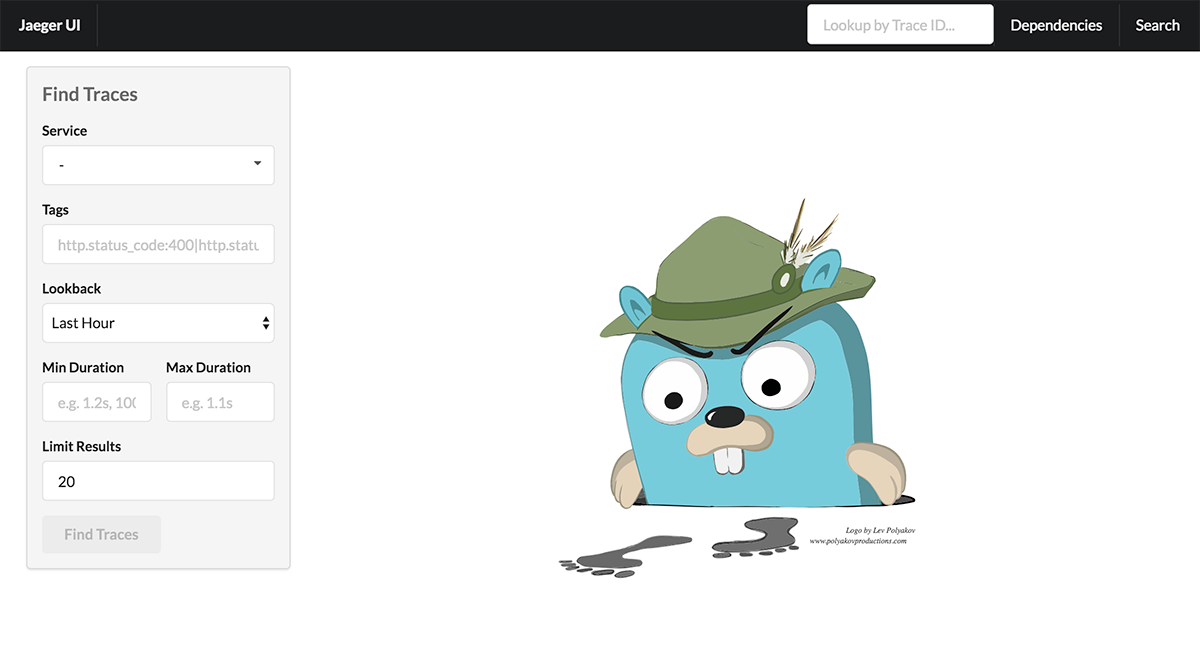
$ docker run -d -p5775:5775/udp -p6831:6831/udp -p6832:6832/udp -p5778:5778 -p16686:16686 -p14268:14268 -p9411:9411 jaegertracing/all-in-one:0.8.0Once the container spins up,the Jaeger UI will be at http://localhost:16686. You should now be ready to start sending traces to your local computer.
Installing an OpenTracing Library for Python
With the Jaeger server running, we’ve now got a place to ship our traces to. We’ll now need to set up Python to be able to ship traces.
For our example, we’ll start with the Jaeger Python bindings of OpenTracing. The binding is installable with pip:
$ pip install jaeger-clientWait, why am I not installing opentracing-python?!
opentracing-python is just a reference API. It’s an empty shell if you will, that each OpenTracing platform must then implement themselves. Changing platforms should just mean changing the initialization of your
tracerobject, and the rest of your code should stay the same.
It’s up to the shipping platforms themselves to implement and extend the API to ship traces to their APIs.
Since we’re using Jaeger, we’ll use Jaeger’s library to ship our traces.
If we were using Datadog or Lightstep’s tracers, we’d use their libraries instead. The same applies to any other platform that implements the OpenTracing API.
Finally, since we’re just playing around with sending traces, let’s use an iPython shell to interactively send traces by hand. To install iPython, it’s just another:
$ pip install ipythonFollowed by typing ipython in a shell. The rest of the code snippets in this tutorial will assume you’re typing or pasting them directly into the ipython shell in one session.
Configuring the Tracer
Now we have a way to ship our Traces from Python, and can jump in and configure a program to be instrumented.
Let’s do that now. We’ll initialize and configure Jaeger’s Python bindings to ship to our local Docker container:
import logging
from jaeger_client import Config
def init_tracer(service):
logging.getLogger('').handlers = []
logging.basicConfig(format='%(message)s', level=logging.DEBUG)
config = Config(
config={
'sampler': {
'type': 'const',
'param': 1,
},
'logging': True,
},
service_name=service,
)
# this call also sets opentracing.tracer
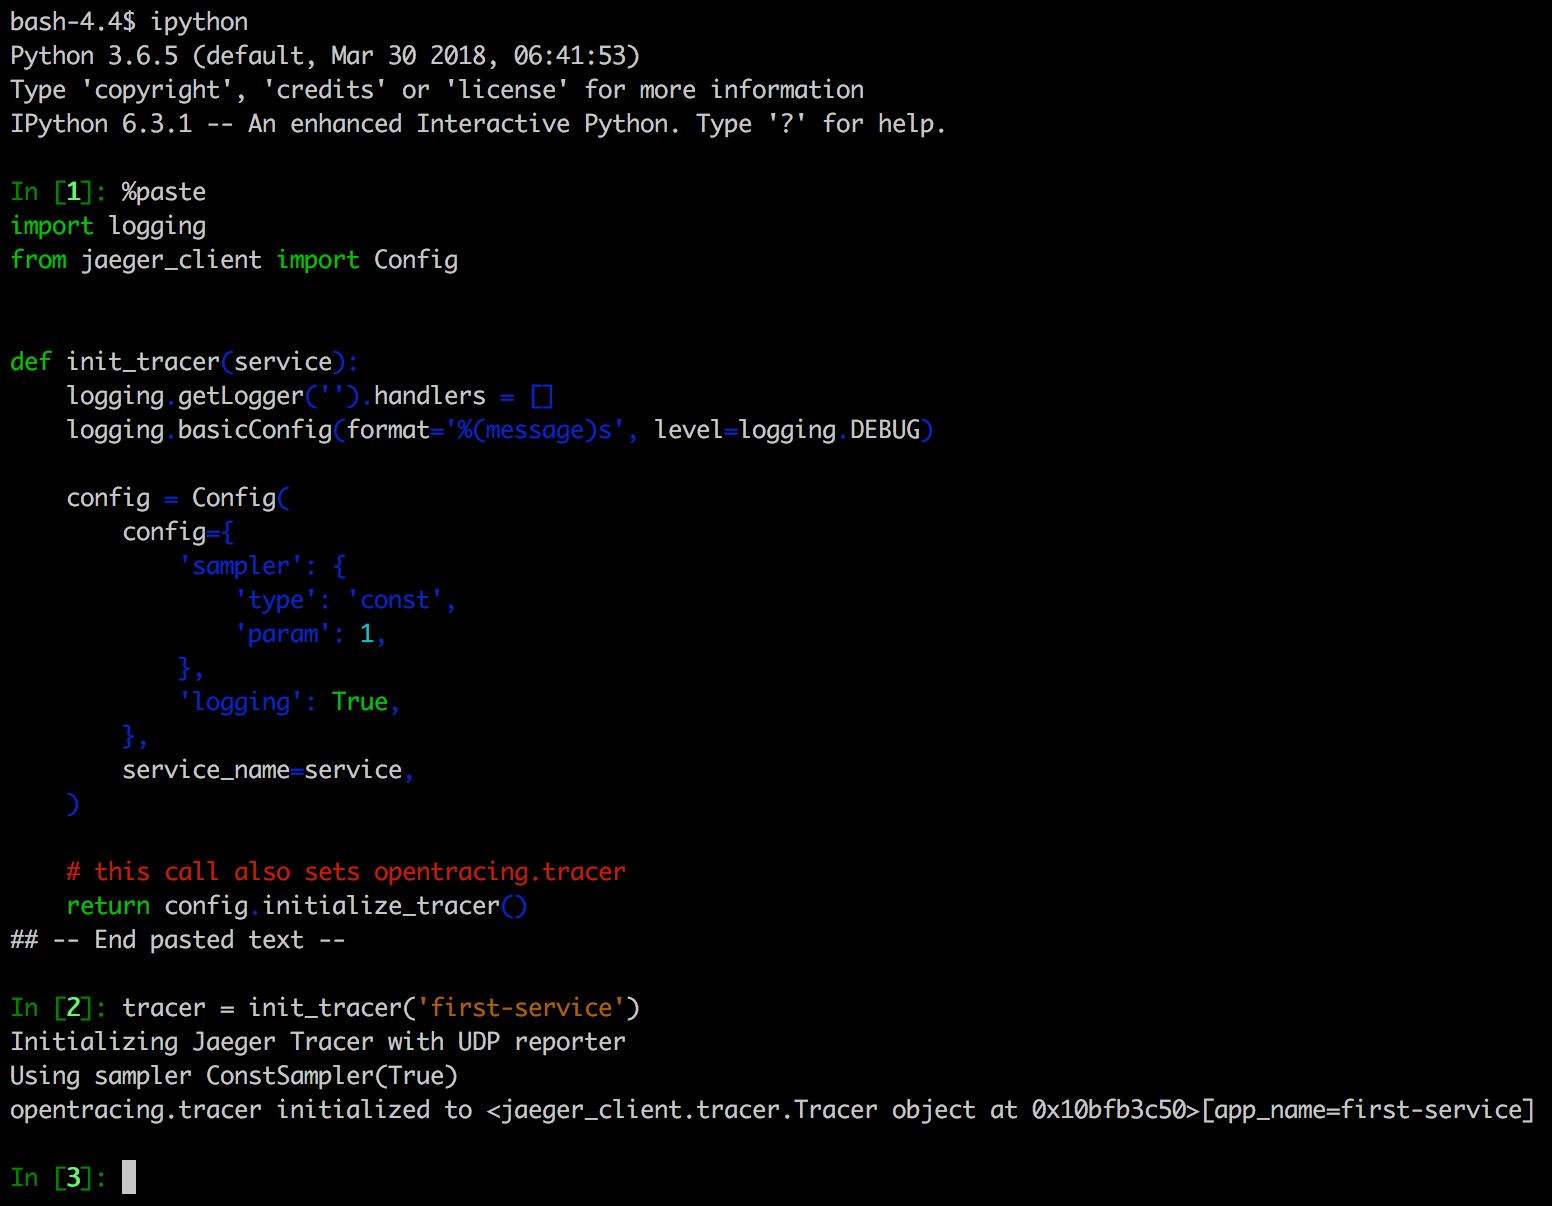
return config.initialize_tracer()You can copy the above text and paste it into iPython’s interactive shell by using the %paste command.
Next, we initialize this tracer, by creating sending the name of our new service to trace:
tracer = init_tracer('first-service')If you’re stuck, this is what your ipython shell should now look like:
Creating Our First Span
With our new tracer, we can now ship our first trace, using a context:
with tracer.start_span('first-span') as span:
    span.set_tag('first-tag', '100')
Typing these lines into the iPython session, we should then see a line that says the span is being reported.
One important note here, the tracer does not flush immediately. If you were to run this in a program, it might exit before the tracer gets a chance to flush, and may not actually end up sending your trace.
In most web / API applications, this shouldn’t matter, as your program will be long running. But if you’re trying to trace a smaller application, it helps to be aware of this caveat.
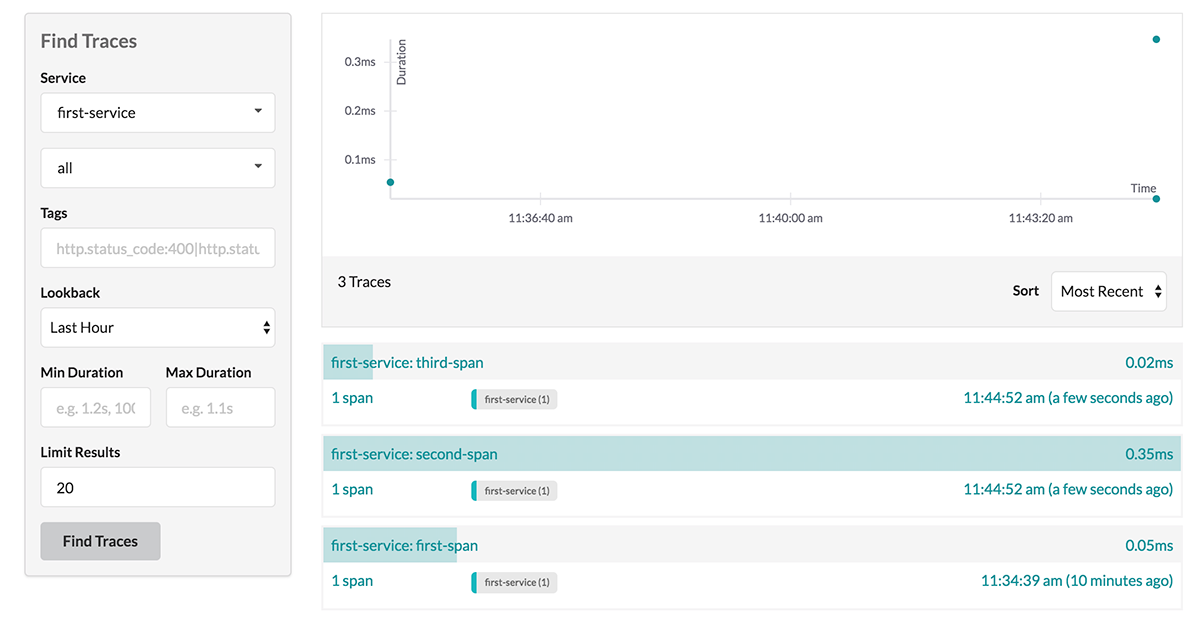
Next, we can reload the Jaeger page at localhost, and see our service in the list of services, along with the trace and span. You may need to click the Find Traces button to see your traces.
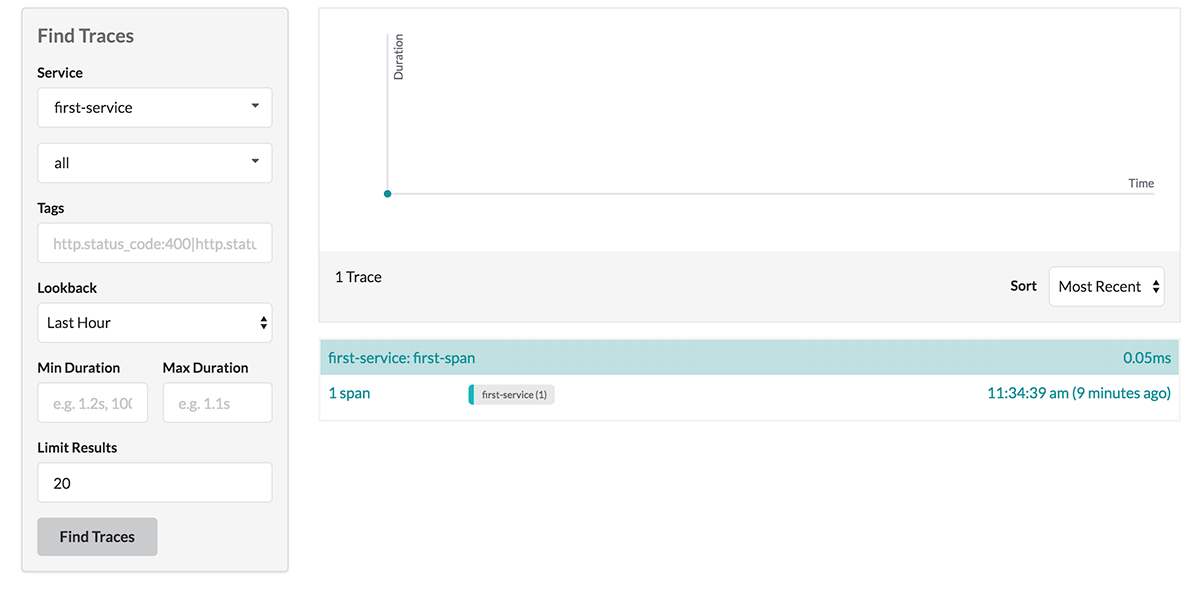
From here, we can start to poke around at the edges of the OpenTracing API, and understand how things work.
What happens if we start a span within another span? Just type it out and try it. See what changes in the Jaeger dashboard.
with tracer.start_span('second-span') as span2:
    span2.set_tag('second-tag', '90')
    with tracer.start_span('third-span') as span3:
        span3.set_tag('third-tag', '80')
If we look in the Jaeger dashboard, we can see our three spans show up separately. There is no link between the spans as we set them. This is because in order to link our spans, we need to set them up as child spans.
Creating A Child Span
Creating a child is done by creating tracer span as a child_of the parent span. Let’s try that now, and see how it changes our spans in Jaeger:
with tracer.start_span('fourth-span') as span4:
    span4.set_tag('fourth-tag', '60')
    with tracer.start_span('fifth-span', child_of=span4) as span5:
        span5.set_tag('fifth-tag', '80')
After running this code in our ipython repl, we can now go into Jaeger, and see our fifth-span successfully made a child of fourth-span.
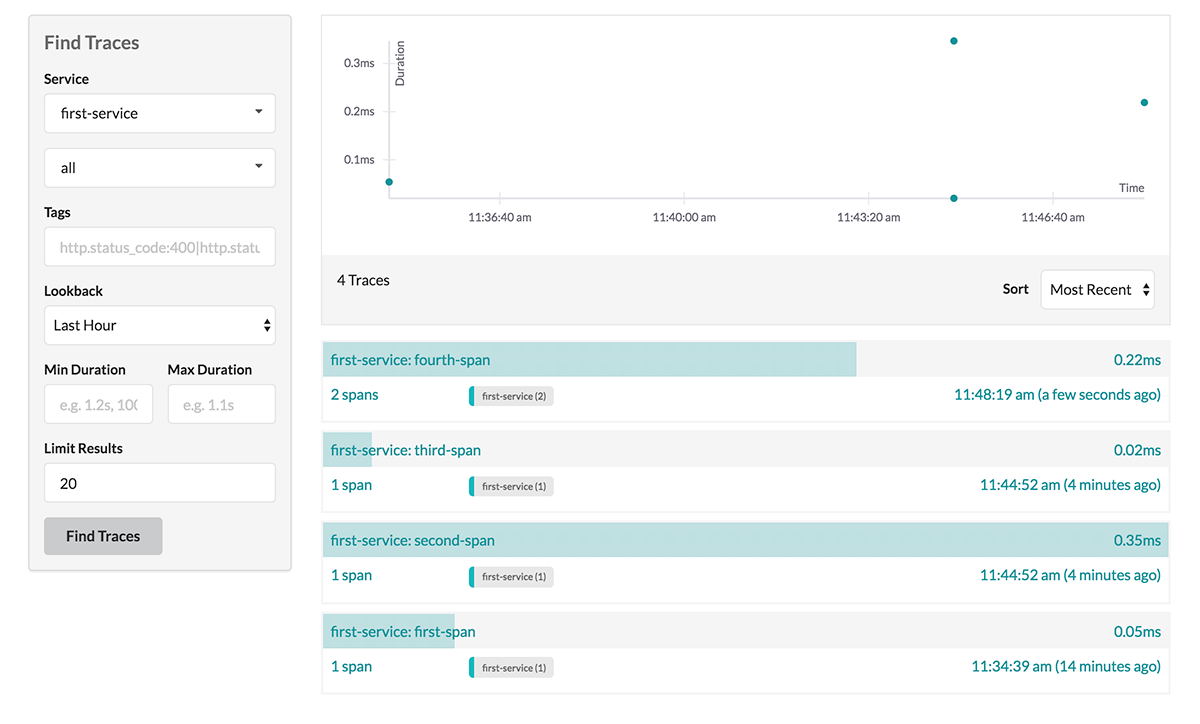
Try putting some delays between our spans to see how this affects your timeline. You’ll start to get a feel for how spans show different delays of time.
Tracing a HTTP Requests
Tracing is most useful when we get to see what’s going on in our systems. Let’s do two HTTP requests that rely on each other, and see how tracing allows us to visualize the process.
Depending on your setup, you might be able to pip install requests directly in your ipython shell. Just use the ! shortcut directly in ipython:
In [6]: !pip install requests
If this command fails, you can always run it in another shell instance and see what went wrong.
Next, we still need to import requests. We can do that immediately, in the same interactive shell:
In [7]: import requests
We’ll use requests to query the Github jobs API for Python jobs, and then get each Company’s listed website.
homepages = []
res = requests.get('https://jobs.github.com/positions.json?description=python')
for result in res.json():
    print('Getting website for %s' % result['company'])
    try:
        homepages.append(requests.get(result['company_url']))
    except:
        print('Unable to get site for %s' % result['company'])
We can now wrap both of these requests in spans, and make each of the child websites a child span of our main request:
with tracer.start_span('get-python-jobs') as span:
homepages = []
res = requests.get('https://jobs.github.com/positions.json?description=python')
span.set_tag('jobs-count', len(res.json()))
for result in res.json():
with tracer.start_span(result['company'], child_of=span) as site_span:
print('Getting website for %s' % result['company'])
try:
homepages.append(requests.get(result['company_url']))
except:
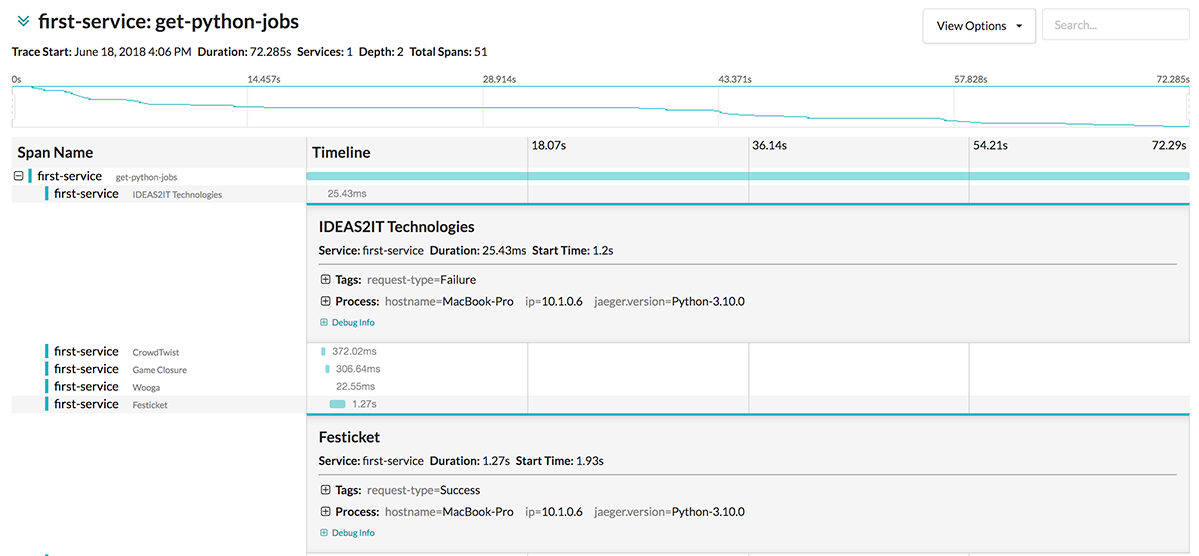
print('Unable to get site for %s' % result['company'])With this, we can now see each of the Company names as the spans for the requests. When we go into the traces for them, we can see how long each company’s page takes to be loaded.
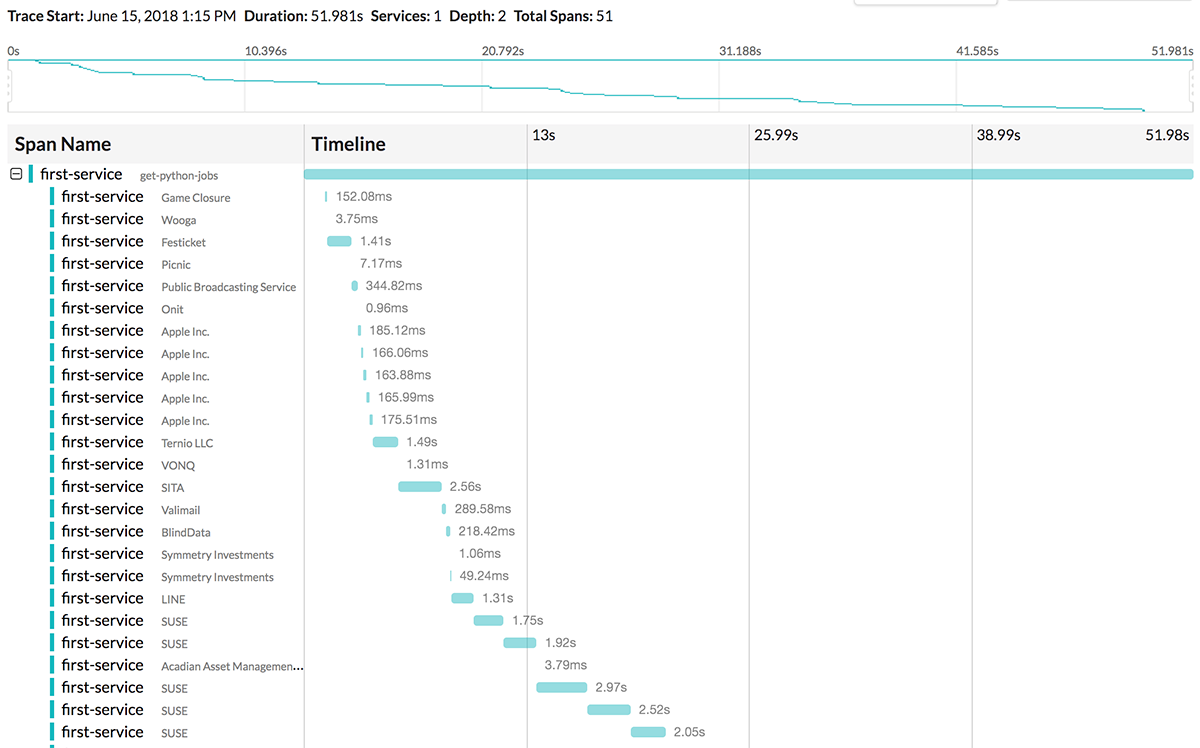
Viewing Traces
When we run the previous code, a lot of our companies won’t have websites, and our web requests will fail.
In order to see the failures, we’ll need to add tagging to our traces.
Once they’re properly tagged, we’ll be able to see them in Jaeger.
To do this, we simply set tags for our requests in the proper try and except states.
with tracer.start_span('get-python-jobs') as span:
    homepages = []
    res = requests.get('https://jobs.github.com/positions.json?description=python')
    span.set_tag('jobs-count', len(res.json()))
    for result in res.json():
        with tracer.start_span(result['company'], child_of=span) as site_span:
            print('Getting website for %s' % result['company'])
            try:
                homepages.append(requests.get(result['company_url']))
                site_span.set_tag('request-type', 'Success')
            except:
                print('Unable to get site for %s' % result['company'])
                site_span.set_tag('request-type', 'Failure')
After we run this, we can then jump into Jaeger and see the results of our new tags, and see which requests work and which don’t: