Tracers
Tracer Interface
The Python Tracer interface creates Spans and understands how to Inject (serialize) and Extract (deserialize) their metadata across process boundaries. It has the following capabilities:
- Start a new
Span InjectaSpanContextinto a carrierExtractaSpanContextfrom a carrier
Each of these will be discussed in more detail below.
Setting up a Tracer
A Tracer is the actual implementation that will record the Spans and publish them somewhere. Python Tracer implementation defines both the public Tracer API and provides a default no-op behavior.
Different Tracer implementations vary in how and what parameters they receive at initialization time, such as:
- Component name for this application’s traces.
- Tracing endpoint.
- Tracing credentials.
- Sampling strategy.
For example, initializing the Tracer implementation of Jaeger might look like this:
import logging
from jaeger_client import Config

def init_tracer(service):
    logging.getLogger('').handlers = []
    logging.basicConfig(format='%(message)s', level=logging.DEBUG)

    config = Config(
        config={
            'sampler': {
                'type': 'const',
                'param': 1,
            },
            'logging': True,
        },
        service_name=service,
    )

    # this call also sets opentracing.tracer
    return config.initialize_tracer()
To use this instance, replace opentracing.tracer with init_tracer(...), like so:
tracer = init_tracer('hello-world')
Complete tutorial is available here.
Starting a new Trace
The Tracer instance obtained can be used to manually create Span that will start a new trace. This can be done in two ways:
Tracer.start_active_span()creates a newSpanand automatically activates it.Tracer.start_span()creates a newSpan
Tracer.start_span() and Tracer.start_active_span() will automatically use the current active Span as a parent, unless the programmer passes a specified parent context or sets ignore_active_span=True.
A new trace can be started like so:
# Manual activation of the Span.
span = tracer.start_span(operation_name='someWork')
with tracer.scope_manager.activate(span, True) as scope:
    # Do things.

# Automatic activation of the Span.
# finish_on_close is a required parameter.
with tracer.start_active_span('someWork', finish_on_close=True) as scope:
    # Do things.
Accessing the Active Span
For getting/setting the current active Span in the used request-local storage, OpenTracing requires that every Tracer contains a ScopeManager that grants access to the active Span through a Scope. Any Span may be transferred to another task or thread, but not Scope. This is implemented as follows:
# Access to the active span is straightforward.
scope = tracer.scope_manager.active()
if scope is not None:
    scope.span.set_tag('...', '...')
Propagating a Trace with Inject/Extract
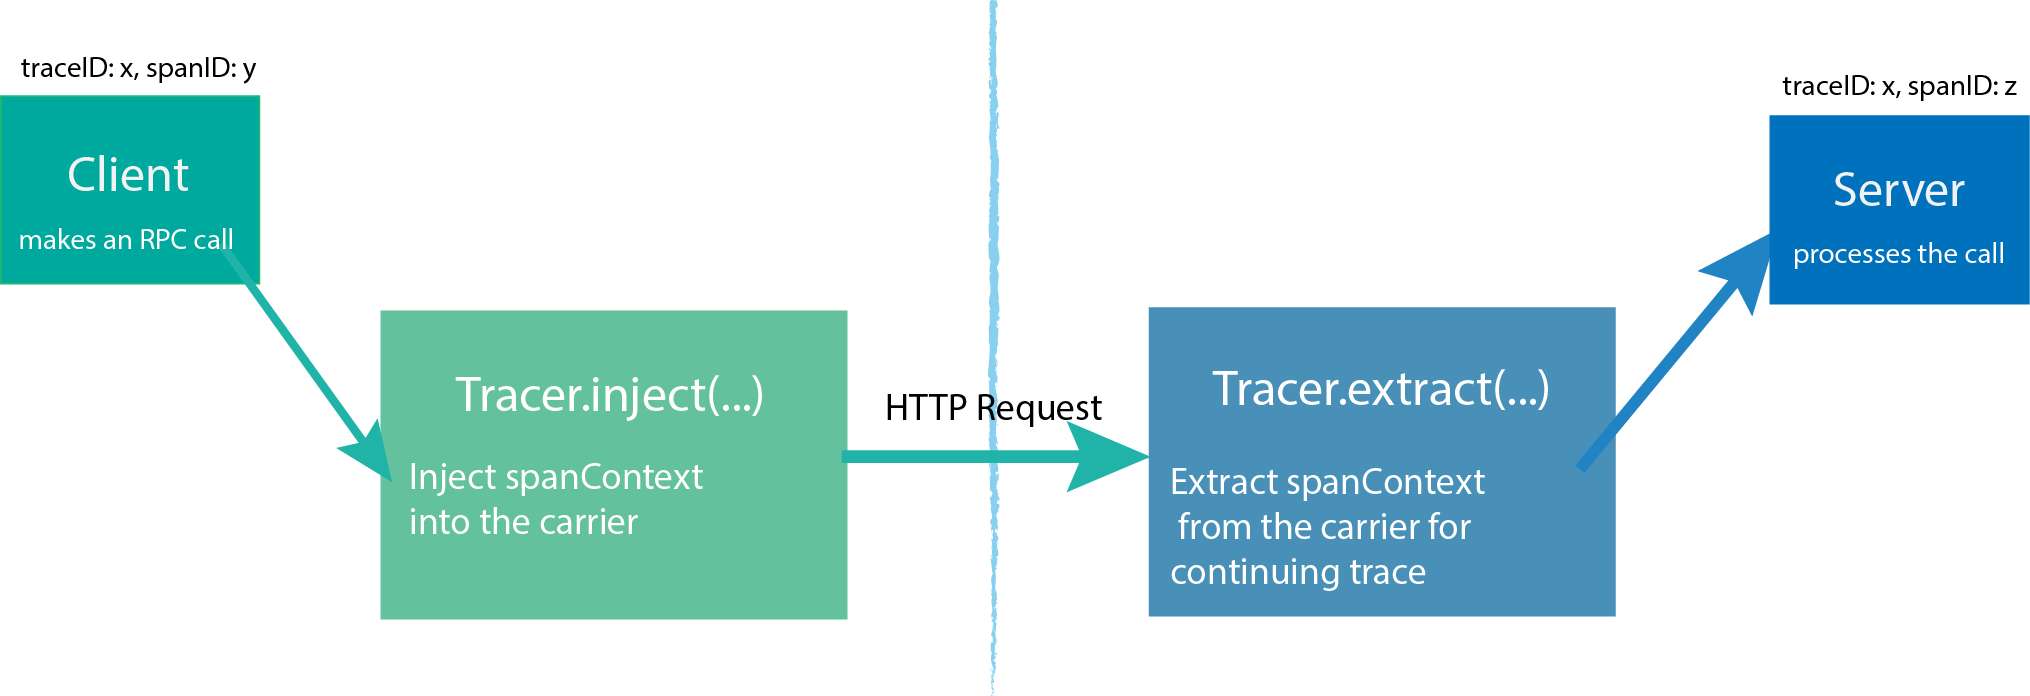
In order to trace across process boundaries in distributed systems, services need to be able to continue the trace injected by the client that sent each request. OpenTracing allows this to happen by providing inject and extract methods that encode a span’s context into a carrier.
The inject method allows for the SpanContext to be passed on to a carrier. The extract method does the exact opposite. It extracts the SpanContext from the carrier.
Injecting/Extracting the spanContext using HTTP format
In order to pass a spanContext over the HTTP request, the developer needs to call the tracer.inject before building the HTTP request, like so:
from opentracing.ext import tags
from opentracing.propagation import Format

def http_get(port, path, param, value):
    url = 'http://localhost:%s/%s' % (port, path)

    span = get_current_span()
    span.set_tag(tags.HTTP_METHOD, 'GET')
    span.set_tag(tags.HTTP_URL, url)
    span.set_tag(tags.SPAN_KIND, tags.SPAN_KIND_RPC_CLIENT)
    headers = {}
    tracer.inject(span, Format.HTTP_HEADERS, headers)

    r = requests.get(url, params={param: value}, headers=headers)
    assert r.status_code == 200
    return r.text
The logic on the server side instrumentation is similar, the only difference is that tracer.extract is used and the span is tagged as span.kind=server.
@app.route("/format")
def format():
    span_ctx = tracer.extract(Format.HTTP_HEADERS, request.headers)
    span_tags = {tags.SPAN_KIND: tags.SPAN_KIND_RPC_SERVER}
    with tracer.start_span('format', child_of=span_ctx, tags=span_tags):
        hello_to = request.args.get('helloTo')
        return 'Hello, %s!' % hello_to
Other implemented examples of inject/extract and details can be found here.