Instrumenting your application
Before getting onto recommendations on how to instrument your large-scale system with OpenTracing, be sure to read the Specification overview.
Spans and Relationships
The two fundamental aspects of implementing OpenTracing across your infrastructure are Spans and the Relationships between those spans:
- Spans are logical units of work in a distributed system, and by definition they all have a name, a start time, and a duration. In a trace, Spans are associated with the distributed system component that generated them.
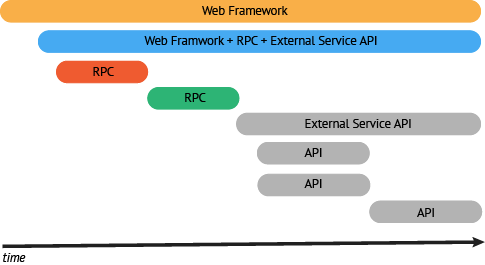
- Relationships are the connections between Spans. A Span may reference zero or more other Spans that are causally related. These connections between Spans help describe the semantics of the running system, as well as the critical path for latency-sensitive (distributed) transactions.
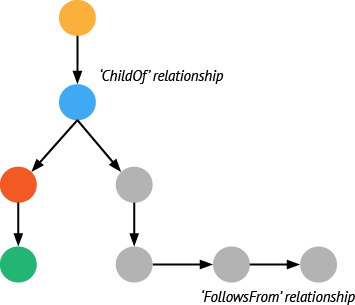
Your desired end state is to emit Spans for all or your code components along with the relationships between those Spans. When starting to build out your infrastructure with distributed tracing, the best practice is to start with service frameworks (e.g., an RPC layer) or other components known to have broad interaction with multiple execution paths.
By using a service framework that is instrumented with OpenTracing (gRPC, etc.) you can get a head start on this effort. However, if you are working with a non-instrumented framework you can get some assistance with this part by reading the IPC/RPC Framework Guide.
Focus on Areas of Value
As mentioned above, start with your RPC layers and your web framework to provide a good foundation for your instrumentation. Both of these will likely have a large coverage area and touch a significant number of transaction paths.
Next you should look for areas of your infrastructure on the path of a transaction not covered by your service framework. Instrument enough of these code components to create a trace along the critical path of a high value transaction.
By prioritizing based on the Spans in your transaction on the critical path and consume the greatest time, there is the greatest opportunity for measurable optimization. For example, adding detailed instrumentation to a span making up 1% of the total transaction time is unlikely to provide meaningful gains in your understanding of end-to-end latency.
Crawl, Walk, Run
As you are implementing tracing across your system, the key to building value is to balance completing some well-articulated high value traces with the notion of total code coverage. The greatest value is going to come from building just enough coverage to generate end-to-end traces for some number of high-value transactions. It is important to visualize your instrumentation as early as possible. This will help you identify areas that need further visibility.
Once you have an end-to-end trace, you can evaluate and prioritize areas where greater visibility will be worth the level of effort for the additional instrumentation. As you start to dig deeper, look for the units of work that can be reused. An example of this would be instrumenting a library that is used across multiple services.
This approach often leads to broad coverage (RPC, web frameworks, etc) while also adding high-value spans to business-critical transactions. Even if the instrumentation for specific spans involve one-off work, patterns will emerge that will assist in optimizing prioritization of future work.
Conceptual Example
Here is an example of this progression to make the approach more tangible:
For this example we want to trace a request initiated by a mobile client and propagating through a small constellation of backend services.
- First, we must identify the overall flow of the transaction. In our example, the transactions look like this:
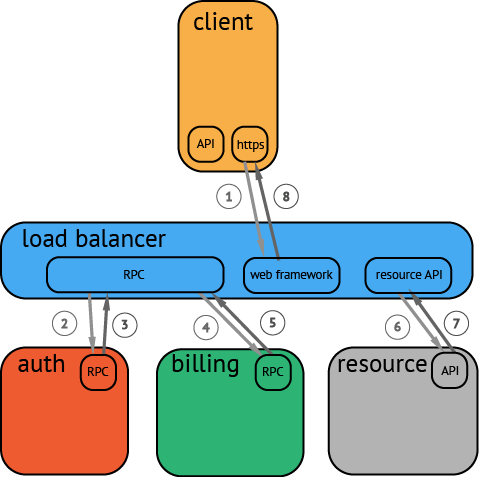
Start with a user action that creates a web request from a mobile client (HTTP) → web tier (RPC) → auth service (RPC) → billing service (RPC) → resource request (API) → response to web tier (API) → response to client (HTTP)
Now that we have high-level conceptual understanding of a transaction flow we can look to instrument a few of the broader protocols and frameworks. The best choice will be to start with the RPC service since this will be an easy way to gather spans for everything happening behind the web service (or at least everything leveraging the RPC service directly).
The next component that makes sense to instrument is the web framework. By adding the web framework we are able to then have an end-to-end trace. It may be rough, but at least the full workflow can be captured by our tracing system.
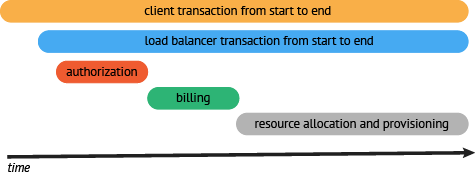
- At this point we want to take a look at the trace and evaluate where our efforts will provide the greatest value. In our example we can see the area that has the greatest delay for this request is the time it takes for resources to be allocated. This is likely a good place to start adding more granular visibility into the allocation process and instrument the components involved. Once we instrument the resource API we see that resource request can be broken down into:
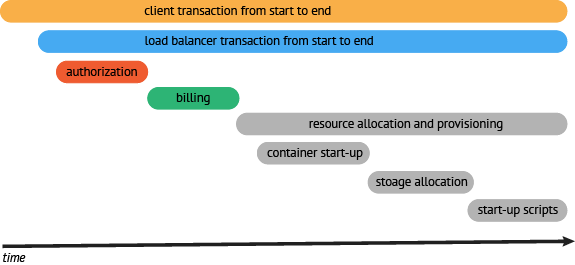
resource request (API) → container startup (API) → storage allocation (API) → startup scripts (API) → resource ready response (API)
- Once we have instrumented the resource allocation process components, we can see that the bulk of the time is during resource provisioning. The next step would be to go a bit deeper and look to see if there were optimizations that could be done in this process. Maybe we could provision resources in parallel rather than in serial.
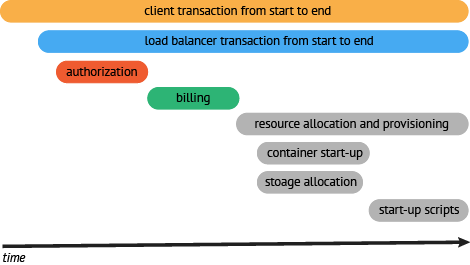
Now that there is visibility and an established baseline for an end-to-end workflow, we can articulate a realistic external SLO for that request. In addition, articulating SLO’s for internal services can also become part of the conversation about uptime and error budgets.
The next iteration would be to go back to the top level of the trace and look for other large spans that appear to lack visibility and apply more granular instrumentation. If instead the visibility is sufficient, the next step would be to move on to another transaction.
Rinse and repeat.
