Introduction
Microservices provides a powerful architecture, but not without its own challenges, especially with regards to debugging and observing distributed transactions across complex networks — simply because there are no in-memory calls or stack traces to do so.
This is where distributed tracing comes into picture. Distributed tracing provides a solution for describing and analyzing the cross-process transactions. Some of the uses cases of distributed tracing as described in Google’s Dapper paper include anomaly detection, diagnosing steady state problems, distributed profiling, resource attribution and workload modeling of microservices.
Distributed Tracing: A Mental Model
Most mental models for tracing descend from Google’s Dapper paper. OpenTracing uses similar nouns and verbs.
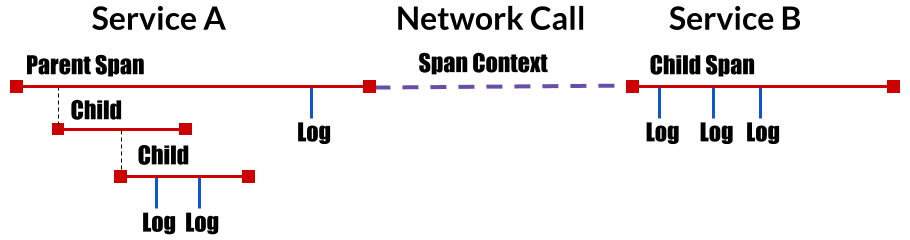
- Trace: The description of a transaction as it moves through a distributed system.
- Span: A named, timed operation representing a piece of the workflow. Spans accept key:value tags as well as fine-grained, timestamped, structured logs attached to the particular span instance.
- Span context: Trace information that accompanies the distributed transaction, including when it passes the service to service over the network or through a message bus. The span context contains the trace identifier, span identifier, and any other data that the tracing system needs to propagate to the downstream service.
The Four Big Pieces
From the perspective of an application-layer distributed tracing system, a modern software system looks like the following diagram:
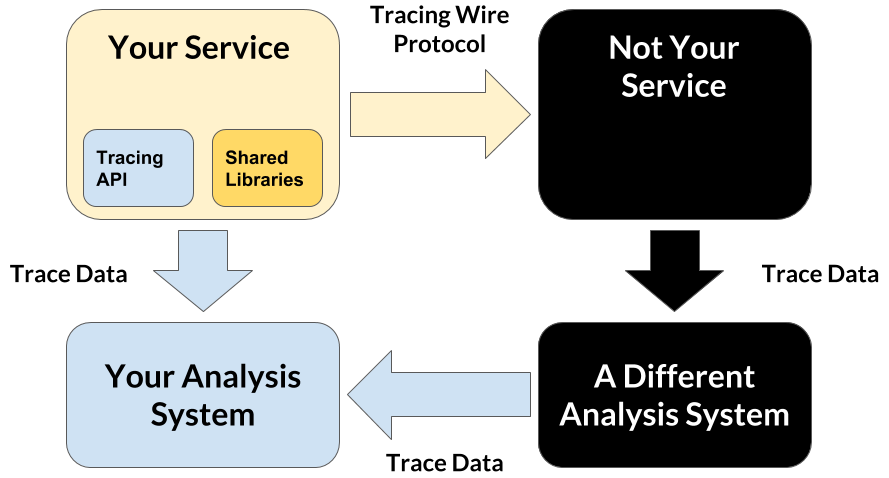
The components in a modern software system can be broken down into three categories:
- Application and business logic: Your code.
- Widely shared libraries: Other people’s code.
- Widely shared services: Other people’s infrastructure.
These three components have different requirements and drive the design of the Distributed Tracing systems which is tasked with monitoring the application. The resulting design yields four important pieces:
- A tracing instrumentation API: What decorates application code.
- Wire protocol: What gets sent alongside application data in RPC requests.
- Data protocol: What gets sent asynchronously (out-of-band) to your analysis system.
- Analysis system: A database and interactive UI for working with the trace data.
How does OpenTracing fit into this?
The OpenTracing API provides a standard, vendor neutral framework for instrumentation. This means that if a developer wants to try out a different distributed tracing system, then instead of repeating the whole instrumentation process for the new distributed tracing system, the developer can simply change the configuration of the Tracer.