Tracers
Introduction
OpenTracing provides an open, vendor-neutral standard API for describing distributed transactions, specifically causality, semantics and timing. It provides a general purpose distributed context propagation framework, consisting of API primitives for:
- passing the metadata context in-process
- encoding and decoding the metadata context for transmitting it over the network for inter-process communications
- causality tracking: parent-child, forks, joins
OpenTracing abstracts away the differences among numerous tracer implementations. This means that instrumentation would remain the same irrespective of the tracer system being used by the developer. In order to instrument an application using OpenTracing specification, a compatible OpenTracing tracer must be deployed. A list of the all the supported tracers is available here.
Tracer Interface
The Tracer interface creates Spans and understands how to Inject (serialize) and Extract (deserialize) their metadata across process boundaries. It has the following capabilities:
- Start a new
Span InjectaSpanContextinto a carrierExtractaSpanContextfrom a carrier
Each of these will be discussed in more detail below. For implementation purposes, check out the specific language guide.
Setting up a Tracer
A Tracer is the actual implementation that will record the Spans and publish them somewhere. How an application handles the actual Tracer is up to the developer: either consume it directly throughout the application or store it in the GlobalTracer for easier usage with instrumented frameworks.
Different Tracer implementations vary in how and what parameters they receive at initialization time, such as:
- Component name for this application’s traces.
- Tracing endpoint.
- Tracing credentials.
- Sampling strategy.
Once a Tracer instance is obtained, it can be used to manually create Span, or pass it to existing instrumentation for frameworks and libraries.
In order to not force the user to keep around a Tracer, the io.opentracing.util artifact includes a helper GlobalTracer class implementing the io.opentracing.Tracer interface, which, as the name implies, acts as a global instance that can be used from anywhere. It works by forwarding all operations to another underlying Tracer, that will get registered at some future point.
By default, the underlying Tracer is a no-op implementation.
Starting a new Trace
A new trace is started whenever a new Span is created without references to a parent Span. When creating a new Span, you need to specify an “operation name”, which is a free-format string that you can use to help you identify the code this Span relates to.
The next Span from our new trace will probably be a child Span and can be seen as a representation of a sub-routine that is executed “within” the main Span. This child Span has, therefore, a ChildOf relationship with the parent.
Another type of relationship is the FollowsFrom and is used in special cases where the new Span is independent of the parent Span, such as in asynchronous processes.
Accessing the Active Span
Tracer can be used for enabling access to the ActiveSpan. ActiveSpans can also be accessed through a ScopeManager in some languages. Refer to the specific language guide for more implementation details.
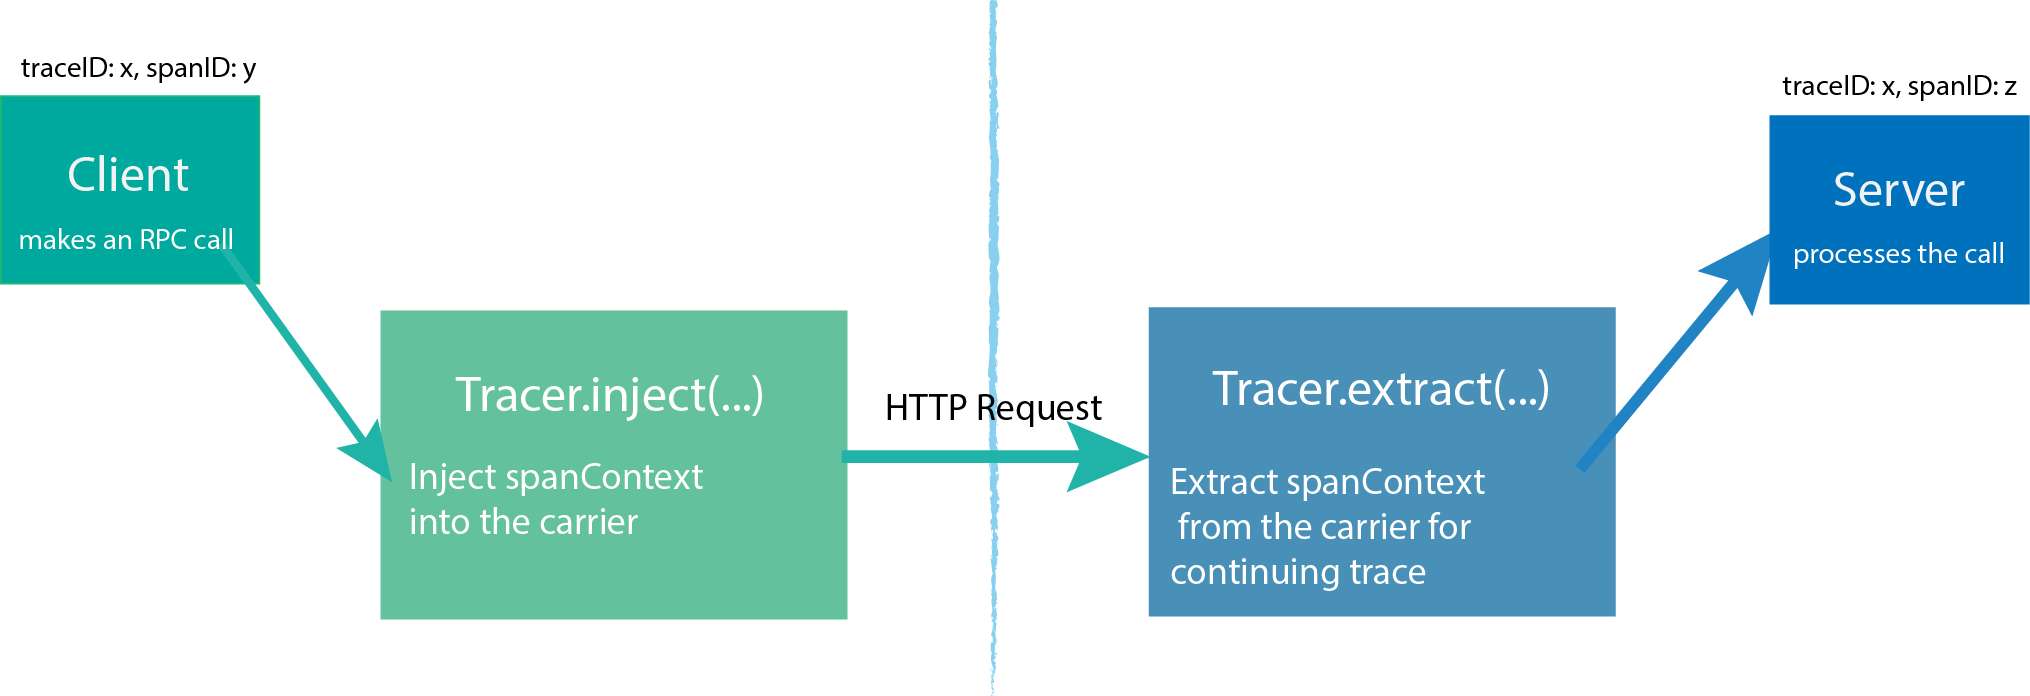
Propagating a Trace with Inject/Extract
In order to trace across process boundaries in distributed systems, services need to be able to continue the trace injected by the client that sent each request. OpenTracing allows this to happen by providing inject and extract methods that encode a span’s context into a carrier.
The inject method allows for the SpanContext to be passed on to a carrier. For example, passing the trace information into the client’s request so that the server you send it to can continue the trace. The extract method does the exact opposite. It extract the SpanContext from the carrier. For example, if there was an active request on the client side, the developer must extract the SpanContext using the io.opentracing.Tracer.extract method.
Tracing Systems
The following table lists all currently known OpenTracing Tracers:
| Tracing system | Supported languages |
|---|---|
| CNCF Jaeger | Java, Go, Python, Node.js, C++, C# |
| Datadog | Go |
| inspectIT | Java |
| Instana | Crystal, Go, Java, Node.js, Python, Ruby |
| LightStep | Go, Python, JavaScript, Objective-C, Java, PHP, Ruby, C++ |
| stagemonitor | Java |